When consulting vine growers and winemakers at the end of each season, we tend to give our impressions on the distinctive features of the climate that year. However, we often do so based on subjective observations of reality. A short period of extreme heat in January or a rainy week close to harvest may leave the impression that the season has been unusually hot or humid, when on average it really was not. What is true is that the physiology of the vine, and therefore the maturation of the grapes, responds to the combination of weather phenomena that begin in the spring (sometimes even before bud break) and end at the time of harvest, more so than individual phenomena.
In this report, we will compare this past season’s temperature and rainfall to the last 31 years for the region of Luján de Cuyo, in order to gain a non-subjective perspective. We will also offer a brief comment on the possible effect of global warming on our climate during the period under review.
Methodology
We have taken our information from two sources: the meteorological station of the Faculty of Agrarian Sciences, located in Drummond (933 m.a.s.l.) and the station that Doña Paula has set up on the El Alto property, in Ugarteche (969 m.a.s.l.), located in the North and South, respectively, of the department of Luján de Cuyo, Mendoza.
We have used a database with data for a 31-year period, from 1988 to 2019, which represents a period that is broad enough to characterize what in climatology is known as climatological normals, that is, the average for each measurement recorded over a 31-year period.
We have worked with the average temperatures for the annual growing season (October 1st to April 30th) and cumulative rainfall during the grape maturation months. We decided not to include spring rainfall in this study due to its lesser influence over final grape quality. Rainfall during the summer and early fall (January to April) is what ultimately has the greatest influence on grape health and, consequently, on the resulting wines.
The results presented reflect the main characteristics of the annual growing season in general. We must clarify that for our analysis, we had to simplify the information in order to reduce the number of variables being studied and the final length of this report.
Temperatures in Luján de Cuyo
As seen in Graph 1, the annual growing seasons show fairly significant temperature variations, ranging from 18.2°C to 21.1°C during the period under review. These three degrees may not mean a very significant difference for our bodies, but they represent an enormous leap for the plant, such that Luján de Cuyo, which is usually category IV on the Winkler scale*, may have total temperatures of a Winkler III in cold years and up to Winkler V in hot years. The colors of the dots on this graph show if the year was cold (blue), cool (light blue), normal (gray), warm (pink), or hot (red).
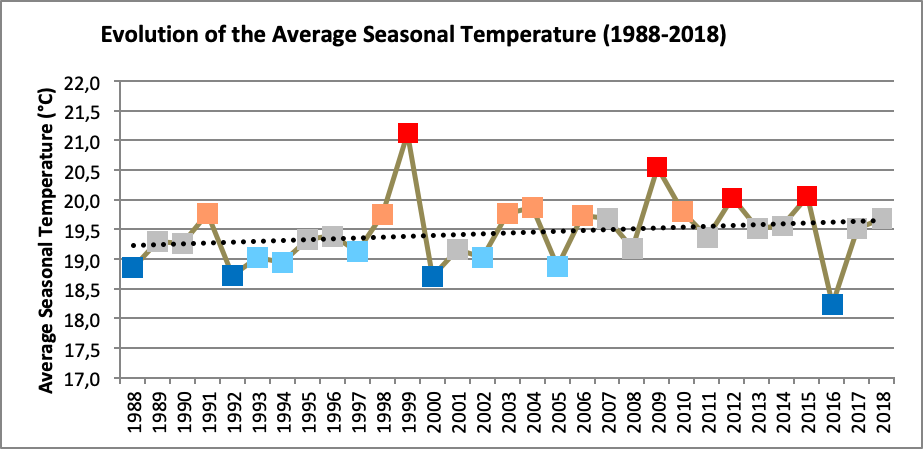
Graph 1: Evolution of the Average Seasonal Temperature. Dot color represents: cold (blue), cool (light blue), normal (gray), warm (pink), or hot (red). Dotted black line: marks the trend.
Despite the variability presented by the growing seasons, there does appear to be a phenomenon of increasing temperatures (see the trend, dotted line) around 0.5°C over the 30-year period under review. According to the results of studied performed by Terroir in Focus (https://donapaula.com/argentine-malbec-climates-influence-in-the-aromatic-compounds-and-in-the-organoleptic-profile/) these variations in temperature may influence the aromatic profile of the wines.
Precipitations in Luján de Cuyo
The majority of the most well-known wine regions around the world have Mediterranean-type precipitations, with most rainfall occurring in the winter and early spring. Western Argentina, where most of the country’s wine regions are located, is characterized by low precipitation and annual averages of 80 to 280 mm. This little rainfall occurs for the most part in the summer, indicating a Monzonic rainfall pattern. The occurrence of rainfall during the maturation period may pose a threat to the complete maturation of some of the most sensitive grapes, like white grapes in general. During extremely rainy years, Malbec grapes have been found to have a higher resistance to rotting than other red grapes like Syrah and Cabernet Sauvignon.
Graph 2 shows the cumulative rainfall during the maturation period (January to April) during the last 31 years, where the color of the bars indicates rainy years (light and dark green), normal years (gray), or dry years (orange and red).
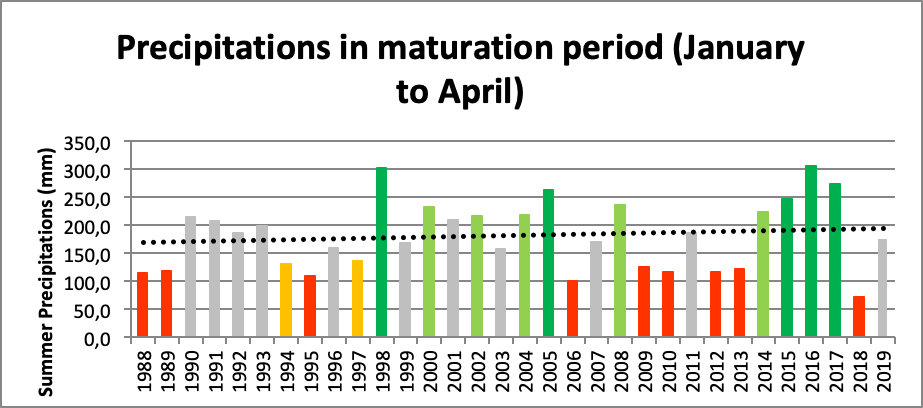
Graph 2: Cumulative Precipitations from January to April of each year. The color of the bar represents if the year was very dry (red), dry (orange), average (gray), wet (light green) or very wet (dark green).
Interaction between Temperatures and Rainfall
In order to graphically compare the temperature and rainfall information for the years under review, we have created a double-input graph (see Graph 3). Here we have created 9 categories which go from cold, wet years to hot, dry years. For example, we can see that the last three growing seasons (2017, 2018 and 2019 harvests) were normal in terms of average temperatures, with normal precipitations in the last harvest, extremely low rainfall in 2018 and abundant rainfall in 2017.
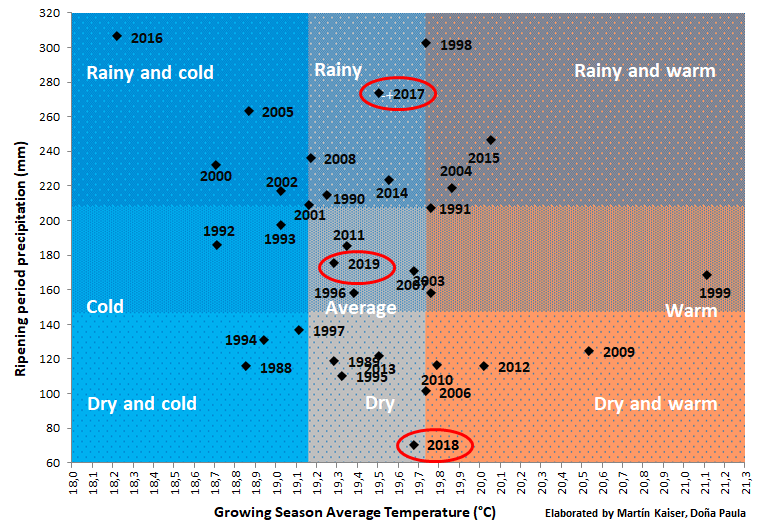
Note: This study shows average data for each growing season, with the understanding that these may hide particularities that may represent large differences among the growing seasons. For example, 2017 was fairly dry during the summer, but in mid-April there was a rainy weather front that generated abundant precipitations that only affected the grapes that had not yet been harvested.
